New study refocuses learning curve analysis on LCOE rather than up-front installed costs in order to provide a more-holistic view of technology advancement
Projecting the future cost of wind and solar generation is a challenge. While analysts employ a variety of methods to understand past wind and solar cost trends and to project future trends, learning curves tend to be the most common approach.
Learning-by-doing is a broadly accepted concept for explaining relationships between technology cost reductions and cumulative output. It posits that costs decline as a function of output as firms learn to make products more efficiently, with the decline in cost per doubling of cumulative output known as the learning rate. Once derived from historical observations, the learning rate can be applied to future output projections in order to estimate future costs.
For reasons of tractability and data availability, past learning curve studies have often focused on the up-front installed cost of wind and solar. But installed cost is just a means to an end, as the ultimate goal is to generate renewable energy. Moreover, installed cost is just one of a handful of inputs—including operating costs, financing costs, and capacity factor—into the levelised cost of energy (LCOE), and each of these LCOE components can benefit from learning. Finally, to date, the wind and solar industries have rightly focused on minimising LCOE, not installed costs (though the two often—though not always—go hand in hand).
In a new study published in the journal iScience, we improve upon past learning curves for utility-scale wind and solar through a combination of approaches. First, drawing on Berkeley Lab’s extensive utility-scale wind and solar plant databases, we calculate plant-level LCOE estimates over time, and then use LCOE, rather than installed costs, to assess historical learning. Second, we normalise LCOE to control for exogenous influences that are unrelated to learning. Finally, we use segmented regression techniques to identify significant change points in normalised LCOE learning—i.e., periods of slower or faster learning.
Figure 1 shows the raw and normalised LCOE history of both wind and solar. These curves—which converged in 2020—represent annual averages of individual plant LCOEs for the vast majority of wind and solar plants built in the United States through 2020. This plant-level granularity allows us to filter out certain exogenous LCOE influences to better separate the learning signal from the noise. For example, the normalised curves in Figure 1 control for changes to regional deployment patterns (via capacity factor, as well as labour and construction costs), exchange rates, finance costs, materials costs (steel for wind, steel and silicon for solar), and income tax rates—all of which fall outside of the control of the wind and solar industries. As a result, the normalised LCOE curves are less-volatile than the raw curves.

Figure 1. Annual Average Raw and Normalised LCOE of Wind and Solar in the United States
Figure 2 shows the learning curves and learning rates (LR) derived from the normalised LCOE history in Figure 1 (shown as dots in Figure 2). Wind’s full-period learning rate of 15% means that for each doubling of cumulative installed wind capacity worldwide, wind’s LCOE has declined by 15%. Solar’s full-period learning rate is higher, at 24%. Segmented regression techniques identify two significant learning change points for wind (around 2006 and 2010), and one for solar (around 2014), with both technologies exhibiting a period of accelerated learning of 40-45% through 2020. Though it is possible that wind’s accelerated learning rate from 2010-2020 is at least partly a correction to the period of negative learning witnessed from 2006-2010, these segmented regression results nevertheless suggest that learning need not be constant over time, nor slow as industries mature.

Figure 2. LCOE-Based Learning Curves for Utility-Scale Wind and Solar Exhibit Distinct Epochs. An asterisk indicates statistical significance (p<0.05).
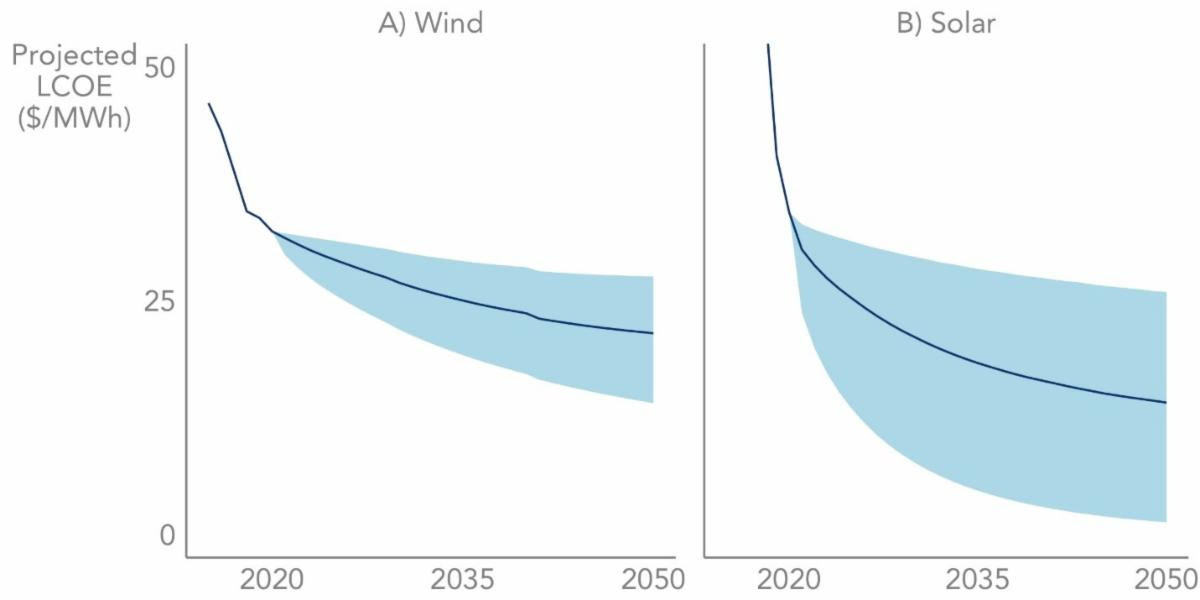
Finally, Figure 3 uses the full-period learning rates from Figure 2 (along with average deployment projections) to project LCOE into the future. We use the full-period rather than the accelerated learning rates to project LCOE because of uncertainty over how long the recent period of accelerated learning might persist (indeed, following the conclusion of our analysis period in 2020, supply chain challenges and commodity price inflation have been pressuring wind and solar costs in 2021 and 2022). With its higher full-period learning rate of 24%, coupled with greater deployment projections, solar’s LCOE is expected to drop below wind’s LCOE within the next few years (from near-parity in 2020)—though there is greater uncertainty surrounding solar’s LCOE projection, given its briefer history.

Figure 3. Projected LCOE Based on Full-Period Learning Rates. The lines represent point estimates and the bands represent 95% confidence intervals.
Whatever the ultimate rate of decline ends up being, the combination of positive learning rates and bullish deployment projections suggest that current cost pressures are likely to be temporary and that, longer term, we can look forward to progressively lower-cost wind and solar energy.
The article in iScience, “Levelized cost-based learning analysis of utility-scale wind and solar in the United States” is ‘open access’ and available to all: https://doi.org/10.1016/j.isci.2022.104378
In addition, a summary slide deck and webinar recording are available at https://emp.lbl.gov/publications/levelized-cost-based-learning.
Choose your newsletter by Renewables Now. Join for free!
 Tucannon River wind farm. Author: Portland General Electric. License: Creative Commons, Attribution-NoDerivs 2.0 Generic


